School of Medical Sciences


2006 competition - winning entries

Light microscopy category and overall trophy winner


constellation_160px

Geoffrey Charters
Auckland Cancer Society Research Centre
School of Medical Sciences

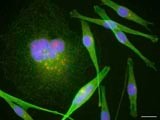
"CONSTELLATION"

Fluorescence microscopy, using ACSRC Zeiss Axioskop 2. Human metastatic melanoma cell-line NZM2 grown on coverslip, fixed in paraformaldehyde and labeled for DNA (Hoechst 33342 (blue)), alpha tubuin (Alexa-fluor 488 (green)), and pericentrin, a centrosomal marker (Alexafluor 594 (red)). Antifade gold mountant.

Demonstrates centrosome numerical dysregulation, thought to be a primary cause of the generation of unstable ploidy in melanoma. In particular, the giant interphase polyploid cell contains at least 19 centrosomes. It has a distorted multi-lobed nuclear morphology, and there is a micronucleus at the bottom right of the centrosome cluster. Most of the other cells are relatively normal G1 cells, with regular nuclei and one centrosome, however at least one is aberrant, with a lobed nucleus and a cluster of perhaps 4 centrosomes. The patches of pericentrin staining associated with nuclei are enigmatic. They are suspected to be nucleolar from limited confocal data, but may be nuclear membrane associated. This could relate to a reported role for pericentrin in nuclear pore structure. 

Transmission electron microscopy category winner


tem_winning_image_160px

Jane Evans
Liggins Institute

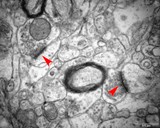
CA1 SUBFIELD OF RAT HIPPPOCAMPUS

Transmission electron micrograph taken at 30,000x magnification, of the CA1 subfield of rat hippocampus. The tissue was fixed with osmium tetroxide and counter-stained with lead citrate and uranyl acetate. On the left is a type two synapse, with symmetric pre- and post-synaptic membranes and elongated vesicles. This type of synapse generally represents inhibitory transmission. On the right is a type one synapse, with characteristic thickening of the post-synaptic density and round presynaptic vesicles. This type of synapse generally represents excitatory transmission. The arrowheads indicate the positions of the synapses. They were not present on the competition entry but have been added subsequently to assist viewers in identifying these synapses. The image was captured with the BIRU's Hitachi H7000 TEM. 

Confocal laser scanning category winner


confocal_winning_image_160px

Kelly Roberts
School of Biological Sciences


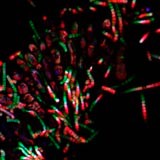
STREAM BIOFILM Confocal image of a stream biofilm labelled with Alexafluor488 (green)and 561 (red) with autofluorescence shown in blue. The image was captured on the BIRU TCS-SP2 confocal microscope at 100 x magnification. 

Medical imaging category winner


ct_scan_moa_skull_160px

Jeremy Corfield
Department of Anatomy with Radiology /
School of Biological Sciences

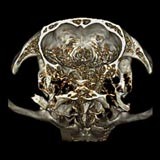
This image is about to be published. Corfield, JR; Wild, JM; Parsons, S; Hauber, ME and Kubke, MF. Evolution of brain size in the Palaeognath lineage, with an emphasis on New Zealand ratites. Brain, Behavior and Evolution (in press)

CT SCAN OF THE INSIDE OF A MOA SKULL

Imaging of the moa skull was only made possible due to the kind assistance of Brian Gill and the Auckland Museum, and the staff of the Green Lane Clinical Centre. Their help is gratefully acknowledged.